
The problem
Sales without a denominator
Revenue alone is misleading
A day with higher takings can hide a falling conversion rate: more people came in, but a smaller share bought. Without visitor numbers you won't notice.
Different stores, wrong yardstick
Two locations with the same revenue can have very different footfall. Comparing them on takings alone means rewarding, or fixing, the wrong store.
Lost hours stay hidden
The time slots when the store is busy but converts poorly are the most expensive ones. They often coincide with too few staff on the floor or a queue at the till.
How it works
How in-store conversion is calculated
The formula is simple: receipts ÷ visitors. The hard part is getting both numbers right, hour by hour.
We count real visitors
From the main-entrance cameras: unique visitors, with staff excluded and anyone coming back within 30 minutes counted once.
We connect your till
Integration with your POS system (e.g. Quenta) or via API. During the pilot we can also start from an export of your till data.
We calculate conversion and value
Conversion rate (receipts ÷ visitors) and value per visitor (conversion × average ticket), by hour, day and store.
You find where to act
The day × hour heatmap shows the slots with plenty of traffic and few sales; the store comparison shows who converts best on equal footfall.
What you measure
What you measure with conversion and POS
Conversion rate
Receipts ÷ visitors, with the trend by day, week and month.
Value per visitor
Conversion × average ticket: what each person who walks in is worth on average.
Day × hour heatmap
Conversion by day of the week and time slot, so weak hours stand out at once.
Receipts and average ticket
From the till, next to footfall: receipts, average ticket and revenue in the same chart.
Store comparison
Network rankings by conversion and value per visitor, not just by revenue.
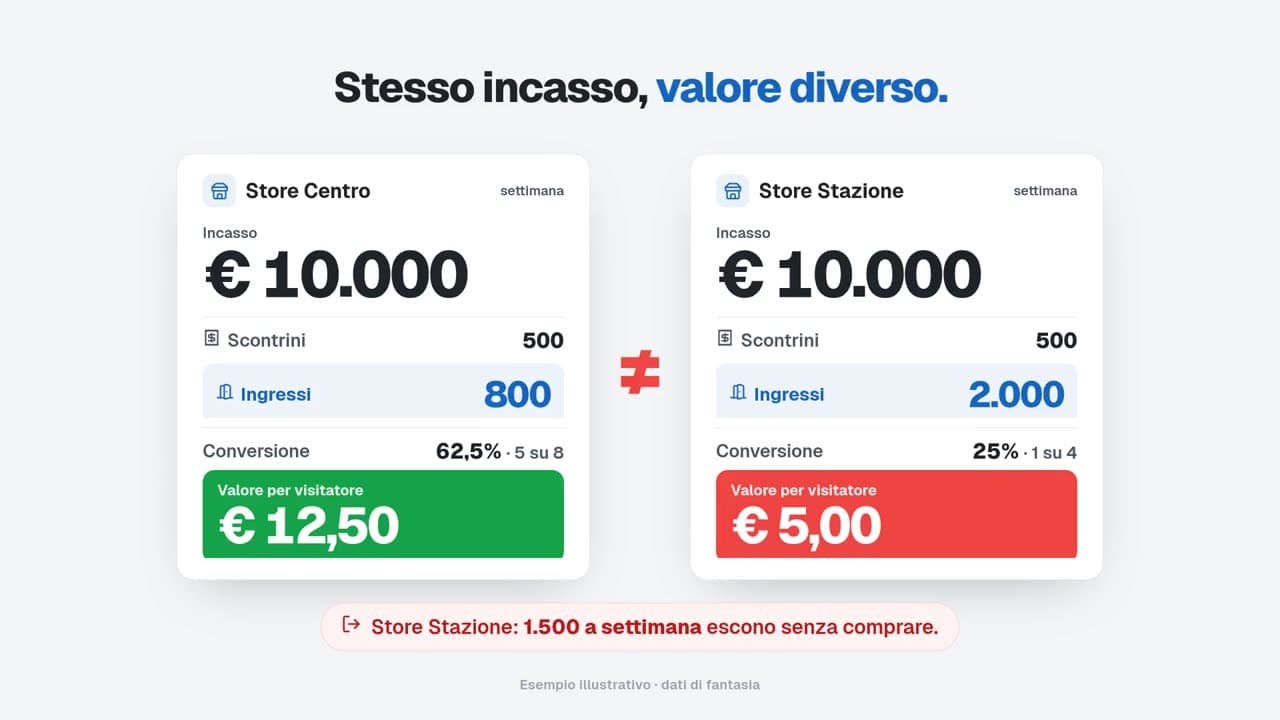
An example
Two stores, same takings
In the management system they look identical: €10,000 and 500 receipts a week each. Add visitors and the difference is plain.
- Store A · 800 visitors · 500 receipts
- 62.5% conversion
- Store B · 2,000 visitors · 500 receipts
- 25% conversion
- Value per visitor, A / B
- €12.50 / €5.00
Illustrative example.
Who it's for
The same metrics, read through the questions of your industry.
Retail & chains
Conversion and value per visitor for every store in the network, with rankings and a map.
Privacy
We measure flows, not people.
Only anonymous, aggregated data
Numbers leave the store, not images.
No identification
Demographic data only in aggregate, optional, and enabled only after an assessment with your DPO.
Staff are not counted
Employees are automatically excluded from every number.
In-store processing, EU hosting
Images stay on site; aggregated data is hosted in Europe.
Frequently asked questions
Divide the number of receipts by the number of visitors over the same period: with 300 receipts and 1,000 visitors, conversion is 30%. Kontrol Flow calculates it by hour, day and store, with staff excluded from the visitors.
Yes, conversion and value per visitor need receipts: integration with your POS system (e.g. Quenta) or via API. During the pilot we can also start from an export of your till data.
It's the average revenue generated by each person who came in: conversion × average ticket, or revenue ÷ visitors. It lets you compare stores with very different footfall.
Yes. The network view shows a map, rankings and the status of each store, so you see who converts best on equal traffic and where it pays to act.
Related solutions
People counting
Unique visitors and entries per door, hour by hour, from the IP cameras you already have, with staff excluded.
Heatmaps and zones
Movement heatmaps and dwell time by zone: average, median, P95 and engaged customers.

AI-powered retail analytics that respects privacy. Transform your store's video feeds into actionable insights.

Stay Updated
Get the latest insights on retail analytics and AI.