
The problem
Planning the week without knowing who'll come
Rotas built on the past
You plan by looking at the same week last year, but the weather and the calendar change every time. The result is too many staff, or too few.
Weather muddles the numbers
A rainy Saturday with few entries looks like a problem with the store. If you don't separate out the weather effect, you fix the wrong thing.
Preparing too much, or too little
In food service every misjudged day costs: waste when you prepare too much, lost sales when the right product runs out.
How it works
How the footfall forecast works
The forecast comes from your store's own data, not from industry averages.
We collect hourly weather
For each store we record temperature, feels-like temperature, rain, humidity and wind, hour by hour.
We measure the weather's impact
We compare rainy, hot or cloudy days with sunny ones, on the same weekday, for visitors and dwell time.
We factor in the calendar
National, regional and local holidays, trading dates and your own events, such as promotions and closures, appear on the charts next to the data.
We forecast the next 7 days
For each store you see expected visitors compared with normal; with your till connected, also what to prepare based on temperature.
What you measure
What you measure with weather and forecasting
7-day forecast
Expected visitors for each store, compared with a normal day.
Weather impact
How much rain, heat or cloud moves visitors and dwell time compared with a sunny day.
Weather-adjusted performance
Find out whether a weak day was down to the weather or to the store.
Holidays and events
Holidays, trading dates and your own events, marked on the charts.
What to prepare
With your till connected: sales by weather condition and product mix by temperature.
Weather across the network
Each store's weather, the forecast for the coming days and how sensitive each one is to the weather.
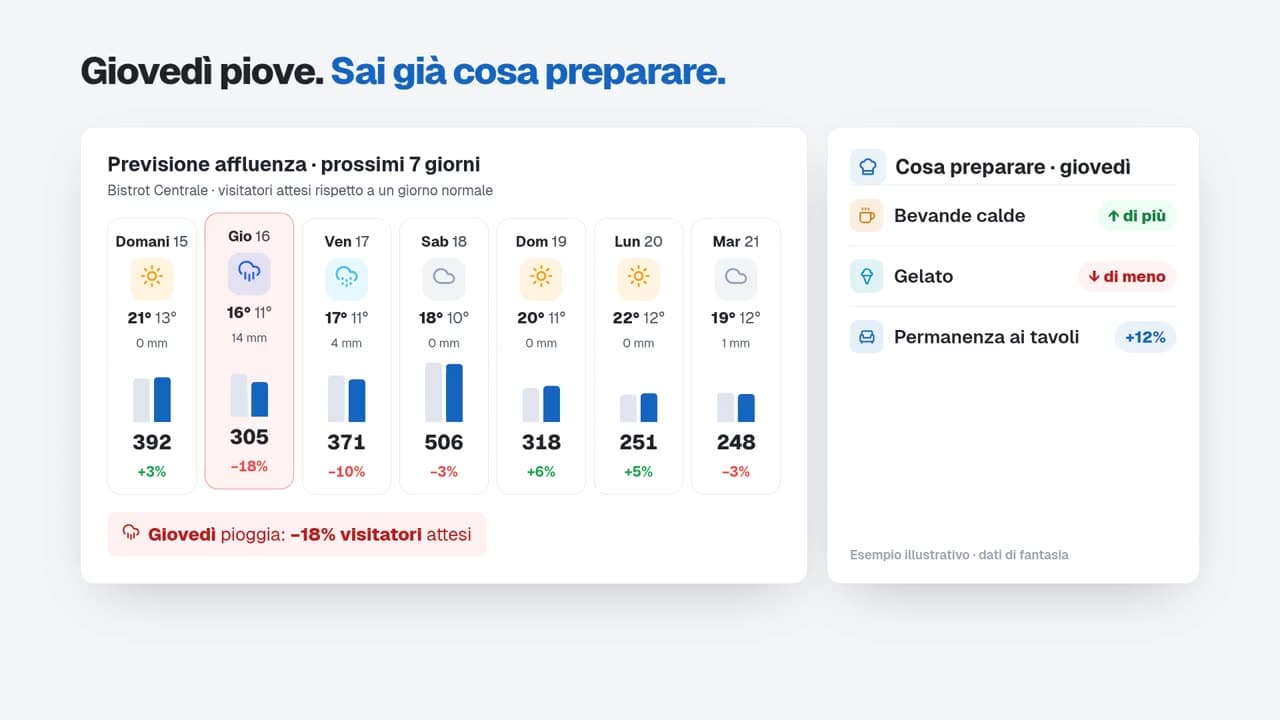
An example
Rain is forecast for Thursday
A pastry shop opens the forecast on Monday morning, before placing its orders.
- Expected visitors on Thursday
- −18% compared with normal
- Typical rain impact on dwell time
- +12%
- To prepare
- more hot drinks, less ice cream
Illustrative example.
Who it's for
The same metrics, read through the questions of your industry.
Food service
Cafés, pastry shops and restaurants: expected footfall and what to prepare based on the weather.
Privacy
We measure flows, not people.
Only anonymous, aggregated data
Numbers leave the store, not images.
No identification
Demographic data only in aggregate, optional, and enabled only after an assessment with your DPO.
Staff are not counted
Employees are automatically excluded from every number.
In-store processing, EU hosting
Images stay on site; aggregated data is hosted in Europe.
Frequently asked questions
Kontrol Flow combines your store's visitor history with the hourly weather forecast and a calendar of holidays and events, and estimates the visitors to expect over the next 7 days compared with normal.
We use the hourly weather for each store's location: temperature, feels-like temperature, rain, humidity and wind. There's nothing for you to set up.
We separate the weather's effect from everything else: if entries on a rainy day drop by as much as rain usually costs, the store performed normally; if they drop further, there's something else to look into.
Yes: sales by weather condition and product mix by temperature need till data. The visitor forecast works with the cameras alone.
Related solutions
People counting
Unique visitors and entries per door, hour by hour, from the IP cameras you already have, with staff excluded.
Real-time occupancy
Live counters, average and peak occupancy per area, and alerts when you exceed capacity.

AI-powered retail analytics that respects privacy. Transform your store's video feeds into actionable insights.

Stay Updated
Get the latest insights on retail analytics and AI.