
The problem
You can see the queue, not the wait
Perceived waiting isn't data
The customer says they waited half an hour, the clerk says ten minutes. Without an objective measure you can't tell who's right, or whether service is getting worse.
Walk-outs are invisible
Someone who comes in, sees a full waiting room and leaves leaves no trace in your management system. It's a lost customer no report shows you.
One more counter, but when?
Without knowing on which days and at which hours waiting goes over the limit, shifts are planned on gut feeling and counters are left unstaffed right at the peaks.
How it works
How we measure waiting and manage queues
Waiting is measured from the moment a customer enters the waiting area to the moment they reach the counter.
We draw the areas
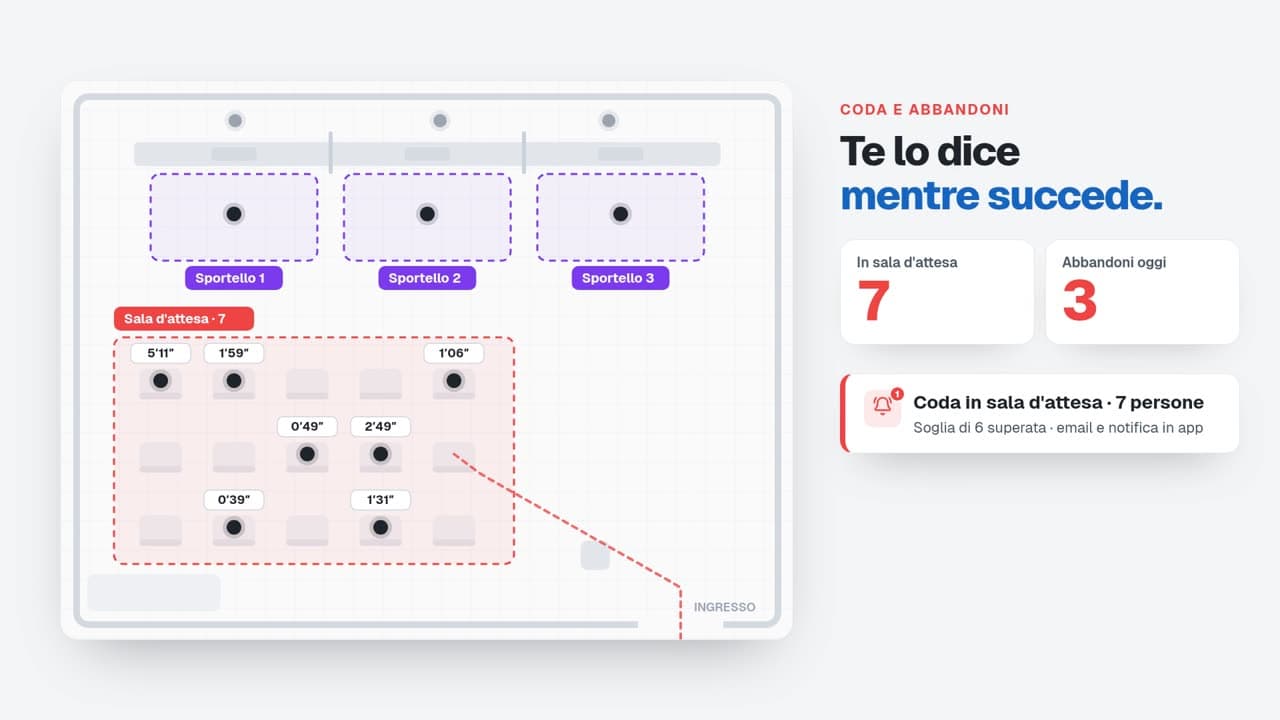
On a snapshot from each camera we mark the waiting area, the queue and each counter.
We link waiting area and counter
The customer is tracked anonymously from the waiting area to the counter, even when the two are covered by different cameras.
We calculate waiting, queue and walk-outs
For every customer served we measure how long they waited; anyone who leaves the waiting area without reaching a counter counts as a walk-out.
You get an alert when it matters
Set a threshold, say more than 6 people in the queue, and get a notification by email and in the notification centre.
What you measure
What you measure at the counter
Wait before service
Average, median and P95 from waiting area to counter: P95 shows how long your unluckiest customers wait.
Live queue
How many people are waiting right now, and how the queue changes through the day.
Walk-outs
People who leave the waiting area without being served, by hour and by day.
Customers served
People who waited and then reached the counter.
Funnel per counter
Customers served and type of transaction, counter by counter, next to the whole-store funnel.
Queue and wait alerts
Thresholds you choose, checked as often as every 5 minutes and only during opening hours.
An example
Tuesday, 5 pm
Two counters open, the waiting area fills up as offices close. Here's what the dashboard shows.
- Median wait
- 3′40″
- P95 wait
- 9′15″
- In the queue now
- 7 people
- Walk-outs in the last hour
- 4
Illustrative example.
Who it's for
The same metrics, read through the questions of your industry.
Counter-service shops
Gold buyers, pharmacies, phone shops, branches: waiting and service measured counter by counter.
Privacy
We measure flows, not people.
Only anonymous, aggregated data
Numbers leave the store, not images.
No identification
Demographic data only in aggregate, optional, and enabled only after an assessment with your DPO.
Staff are not counted
Employees are automatically excluded from every number.
In-store processing, EU hosting
Images stay on site; aggregated data is hosted in Europe.
Frequently asked questions
For every customer served we measure the time between entering the waiting area and reaching the counter. The dashboard shows the average, median and P95, by time slot, day and counter.
Yes. The same person is tracked anonymously across the store's cameras, without being identified, so waiting is measured even when the waiting area and the counters are covered separately.
A customer who enters the waiting area and leaves without reaching a counter. You see how many walk-outs there are and which time slots they cluster in, so you know when to add staff.
No. Staff are excluded automatically: Kontrol Flow measures customer waiting and flow, not employees' work.
Related solutions
Real-time occupancy
Live counters, average and peak occupancy per area, and alerts when you exceed capacity.
Heatmaps and zones
Movement heatmaps and dwell time by zone: average, median, P95 and engaged customers.
People counting
Unique visitors and entries per door, hour by hour, from the IP cameras you already have, with staff excluded.

AI-powered retail analytics that respects privacy. Transform your store's video feeds into actionable insights.

Stay Updated
Get the latest insights on retail analytics and AI.