
The problem
Layout is often decided by eye
Hot zones and dead zones
You know some areas work harder than others, but not by how much. Without data, moving a display or a promotion is a gamble.
Passing isn't stopping
A busy walkway isn't necessarily an area people care about. What counts is how many people stop, and for how long.
Averages that hide everything
An average dwell time of two minutes can mean everyone stays two minutes, or a few stay a long time and many walk past. You need the distribution.
How it works
How heatmaps and dwell time by zone work
You choose the zones, on your own camera images. Kontrol Flow measures the rest.
We draw zones on the snapshot
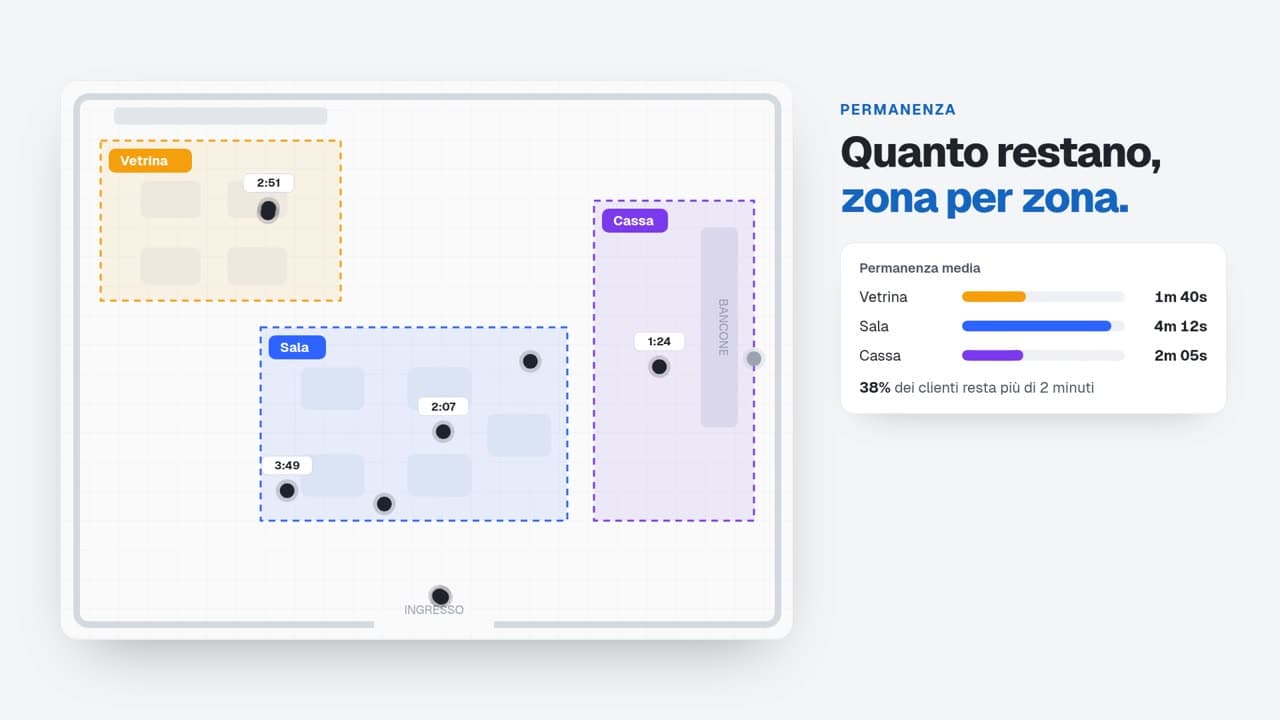
On a still from each camera we mark the areas you care about: displays, departments, counter, tables, till.
We build a heatmap per camera
Customer positions build up into a movement heatmap, camera by camera: you see at once where people gather.
We measure dwell time
For each zone we calculate the average, median and P95 dwell time, and the distribution from a few seconds to over 30 minutes.
We split engaged from browsing
Pick a threshold, say 2 minutes: anyone who stays longer is an engaged customer, anyone who stays less is just browsing.
What you measure
What you measure with heatmaps and zones
Movement heatmap
For each camera, where customers move and stop most often.
Dwell time by zone
Average, median and P95 of how long people stay in each area.
Dwell-time distribution
How many stay a few seconds, a few minutes or more than half an hour.
Engaged or browsing
Who stops beyond the threshold you choose, and who walks on.
Configurable zones and areas
Departments, displays, counter or tables: zones follow your layout and are updated when you change it.
Occupancy by zone
Average and peak number of people in each area.
An example
Is the new display working?
A store moves a display next to the entrance and compares the week before with the week after.
- Median dwell at the display
- from 0′35″ to 1′20″
- Engaged customers (over 1 minute)
- from 12% to 31%
- Hottest zone on the heatmap
- from the back to the entrance
Illustrative example.
Who it's for
The same metrics, read through the questions of your industry.
Privacy
We measure flows, not people.
Only anonymous, aggregated data
Numbers leave the store, not images.
No identification
Demographic data only in aggregate, optional, and enabled only after an assessment with your DPO.
Staff are not counted
Employees are automatically excluded from every number.
In-store processing, EU hosting
Images stay on site; aggregated data is hosted in Europe.
Frequently asked questions
Kontrol Flow detects customers' positions anonymously in each camera's images and builds them up into a heatmap. Images are processed in the store: only the heatmap and aggregated data reach the dashboard.
Yes. Zones are drawn on a snapshot from each camera and grouped by type: department, counter, tables, till. When you change your layout, you update them.
It's the time within which 95% of customers leave: it shows the longest stays without being skewed by a handful of extreme cases. Together with the average and median it gives the full picture.
No. The heatmap shows where people gather, not who they are: no identification, only anonymous, aggregated data, with staff excluded.
Related solutions
People counting
Unique visitors and entries per door, hour by hour, from the IP cameras you already have, with staff excluded.
Queue and wait time
Average, median and P95 wait from waiting area to counter, queue, walk-outs and alerts.

AI-powered retail analytics that respects privacy. Transform your store's video feeds into actionable insights.

Stay Updated
Get the latest insights on retail analytics and AI.